ArrayPipe Online Documentation
[← previous] [up ↑] [next →]
Correlation coefficient colour matrix
One of the previously available features, the calculation of correlation coefficients, has been extended.
ArrayPipe now produces a colour matrix in which all the pairwise comparisons are shown graphically, as can be seen here on the swirl data set after printtip loess normalization:
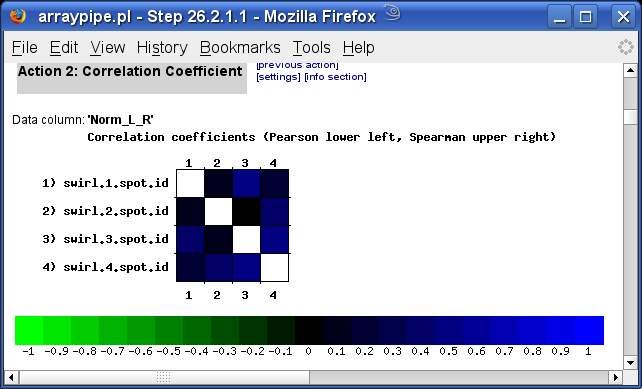
The upper right half presents the Spearman rank coefficients and the lower left half presents the Pearson coefficients. The cells for file matches with themselves are left empty (white). All coefficients are calculated from the log2-ratios. The legend below the matrix indicates the colour shading for the different values.
You can see that the match between reversed dyes is not particularly good. However this becomes much worse if the dye-swap box in the data settings section had not been ticked:
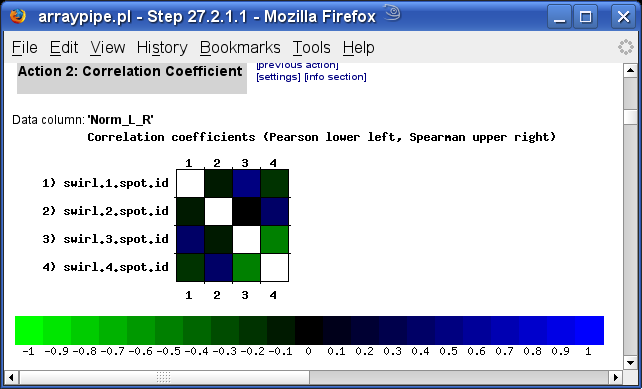
This visualization tool can be used as a simple method to quickly check for
proper assignments of dye-swaps and channel annotation.
[← previous]
[up ↑]
[next →]
Home
for questions or remarks e-mail karsten_hokamp@sfu.ca.