ArrayPipe Online Documentation
[← previous] [up ↑] [next →]Sample Analysis
Normalization
Let's apply background correction and normalization to see if that sufficiently removes the technical bias:
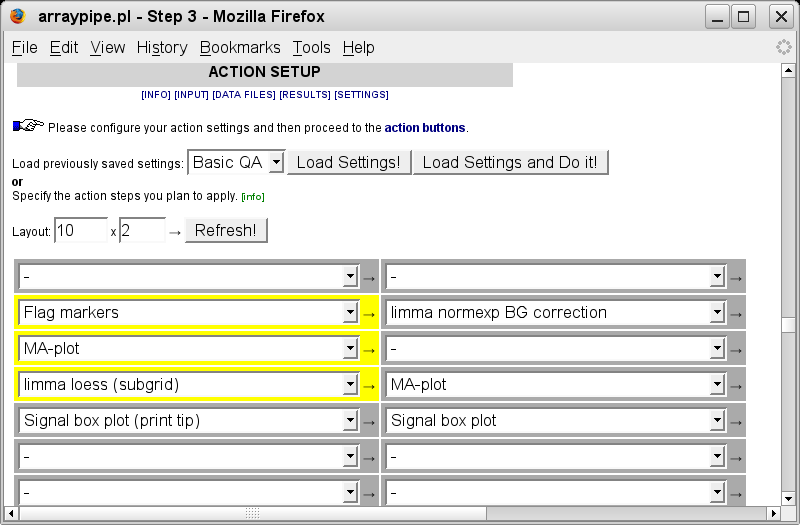
Clicking on the 'Do it!' button brings up new results.
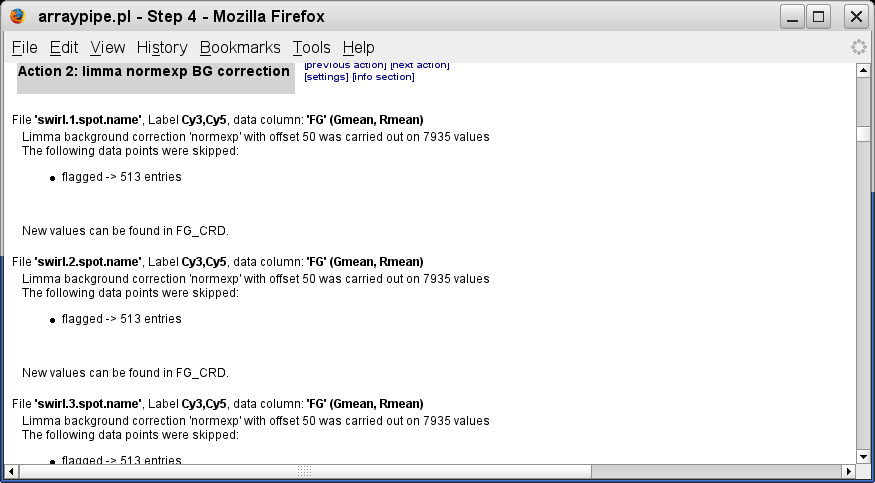
The output of the background correction indicates that an offset of 50 was
applied and 513 spots have been excluded because they were flagged (as markers):
(go to original page)
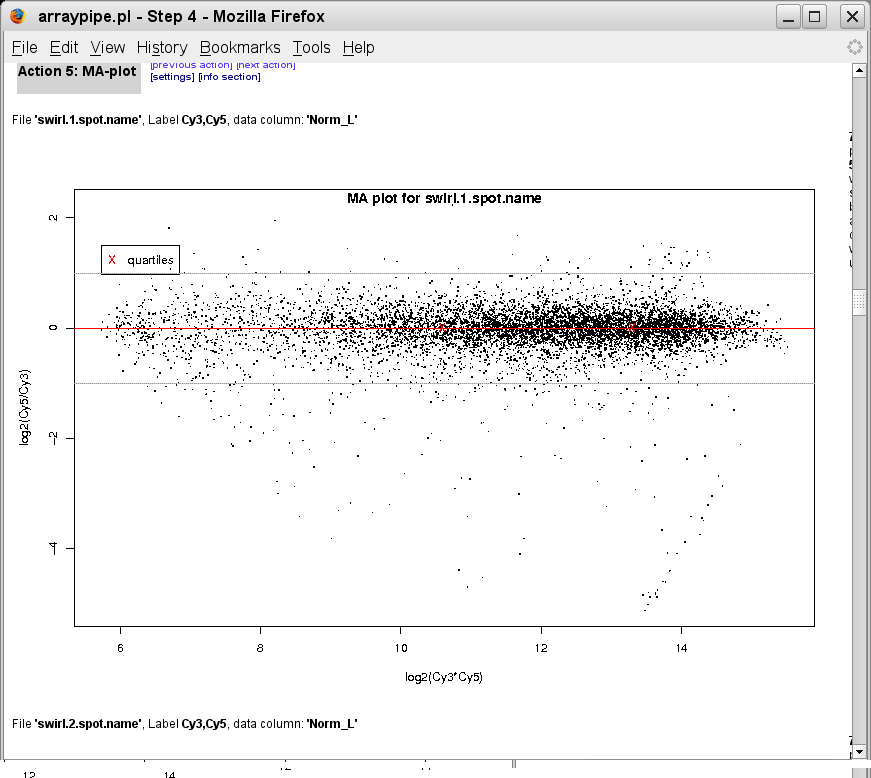
The MA plots haven't changed much but it is important to check them because certain types of data can get fairly scrambled up after the normexp background correction.
The reports of the loess printtip normalization indicate no problems and the subsequent MA plots do indeed look much better now:
(go to original page)
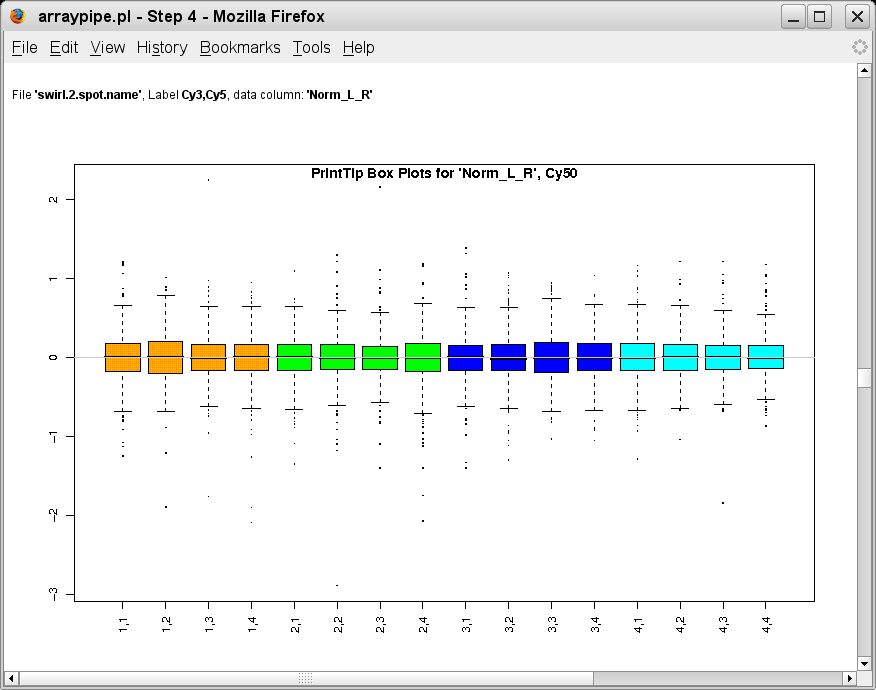
The boxplots for the individual subgrids are also brought into alignment, as can be seen for the second swirl data file:
(go to original page)
In the next step boxplots are generated for all data sets beside each other and indicate slight variation between slides:
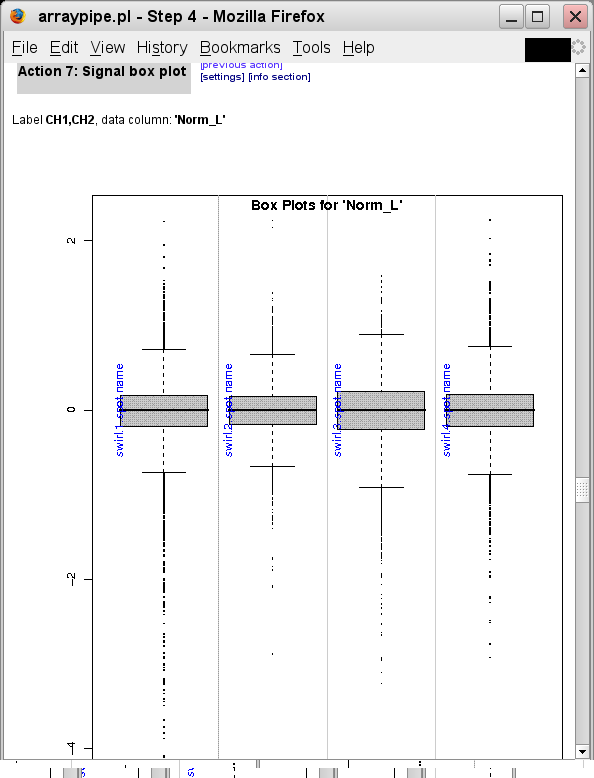
(go to original page)
It would be possible to adjust for this using the 'marray: globalMAD'
normalization procedure after the limma loess (subgrid) step, but one has to
be careful not to overdo the data transformation and thus massage out biologically
interesting variations.
[← previous]
[up ↑]
[next →]
Home
for questions or remarks e-mail karsten_hokamp@sfu.ca.